Archives September 2021

USD to INR Price and Forecast

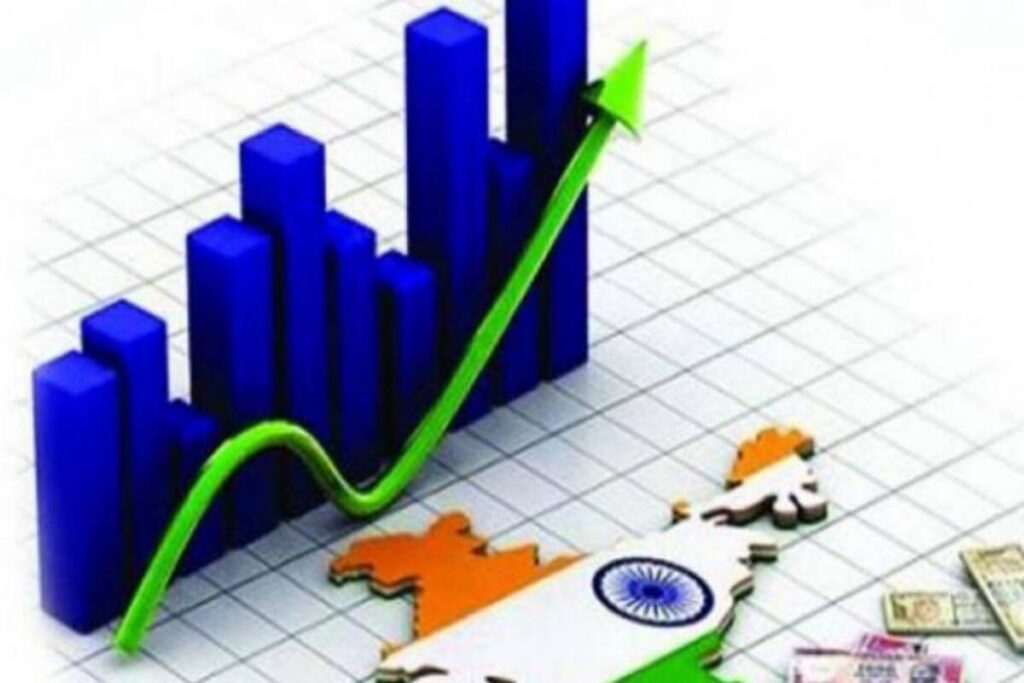
USD to INR Price and Forecast is expected to go up in times to come. This is very important for you to hedge accordingly irrespective of the nature of your profession.

Please find the current USD to INR Price and forecast

Forecast by 2030 is of 100+.

Here INR is the Indian rupee and our currency.
USD to INR Price and Forecast

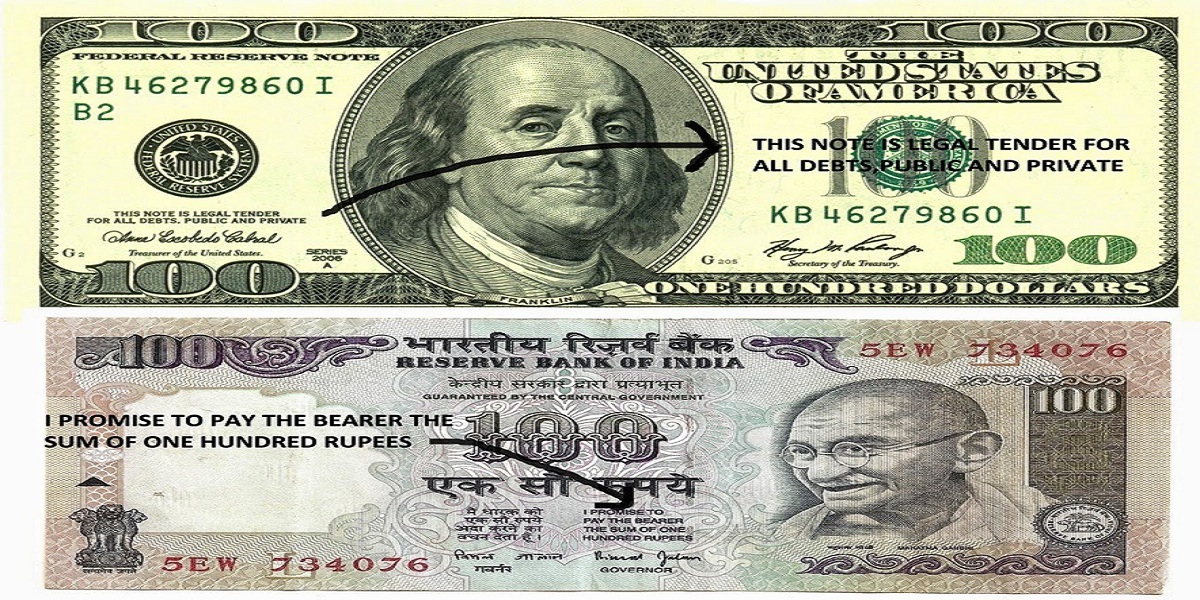
On the other hand, we have US dollar which is labelled as reserve currency of the world. Most of the trade in world happens in US$ and its price movement, majorly measured through Dollar Index decides the strength and weakness in major commodities like Nickel, Crude, Gold, Natural Gas, etc.

There are innumerable factors that influences the conversion rate of a currency like:

  1. Macroeconomic factors

Higher rank in terms of strength and efficacy of a country’s institutions and policy makers leads to lower yields. Effectiveness of government and its policy, its accountability and strength of the legal system—are qualitative measures of the degree to which a respective sovereign borrower can be expected to implement policies and measures that are consistent with sound management of the economy in general and of its debt obligations.

Health of a currency is directly proportional to the macroeconomic factors of a country. In the case of India, the reforms which started in 1991 are supplemented by key reforms like GST, Demonetization, NCLT, RERA, Jan Dhan, etc. which will be long term beneficial for India’s growth.

2. Inflation

India had significantly higher inflation in the last decade compared to US. It was hovering around 4-7% where in it was around 1-2% in US. Even now and in times to come, it is expected that inflation differential in between India and US will be around 5%. USD to INR Price and Forecast is expected to go up it by at-least the differential amount.

USD to INR price and forecast is very highly dependent on Inflation. Inflation erodes the value of money in long time.

3. Interest Rates

When interest rates are kept at zero by US Fed, RBI in India has cut down the repo rate by 25 basis points to 5.15% from 5.75% in Aug’21. In the same line, the reverse repo rate was also reduced to 4.9% from 5.5%. This huge difference in interest rates speaks for two economies and hints at depreciating rupee in long term.

Our higher interest rates as compared to western world puts pressure on our currency.

4. Public Debt

As of Marcg’21, India’s external debt was placed at US$ 570.0 billion, recording an increase of US$ 11.5 billion over its level at end-March’20. The external debt to GDP ratio increased to 21.1 per cent at end-March 2021 from 20.6 per cent at end-March 2020.

Valuation loss due to the depreciation of the US dollar against Indian rupee and major currencies such as euro and pound sterling was placed at US$ 6.8 billion. Excluding the valuation effect, the increase in external debt would have been US$ 4.7 billion instead of US$ 11.5 billion at end-March 2021 over end-March 2020.

With the plans of government for this decade, public debt is expected to rise and will exert pressure on INR valuations vs US dollar.

5. Demand and Supply

Indian money is in demand not only from the domestic market (for any transaction), but also from foreign money that needs to enter the country (exchanging dollars or other currencies into rupees). If there is remittance, it is also in demand (earnings outside India flowing back through people working there, or foreign operations of Indian companies, or exports).

On the other hand, supply happens from RBI printing the money and when currency is leaving the country and being exchanged for dollars. It is also supplied when we import things as the price has to be paid in US$.

Over a long period of time, this equation will lead to net flow of dollar outside India at least till 2030 and will lead to INR depreciation. One of the major factor here is the import of Crude which is expected to double from current capacity by 2030-35 and will lead to pressure on INR.

6. Economic Growth

India is expected to grow at 10% this financial year, 2021-22. With better economic growth, there are investment avenues generated in the country which attracts foreign capital. Also, higher GDP growth lead to lower yields. First, government tax revenue increases leading to lower deficit and debt levels and gives better financial resources to service debt. Second, as we attract more foreign capital investment, which increases our US Dollar reserves, it allows us to service our debt easily.

7. Current and Fiscal Account Deficit

In the case of India, both of these are negative. Currently, fiscal deficit is around 6%. India’s current account balance recorded a deficit of $8.1 billion (1% of GDP) in the quarter ended March 2021 (Q4FY21) on the back of a higher trade deficit and lower net invisible receipts. Higher fiscal  and current account deficit mean higher yields and pressure on currency.

8. Central Bank Intervention depending upon whether it’s a free market currency or fixed.

India’s currency exchange is free and market driven. However from time to time, there is intervention by central bank to absorb shocks but they don’t interfere with the free market dynamics and policies. Our currency has depreciated from 45 in 2011 to 75 in 2021, close to 67% in 10 years and the trend is expected to continue. 
USD to INR price and forecast is very much dependent on reserve bank of India.
With above factors in consideration and most importantly, with no current plan by Indian Government to position INR in international trade as a big reserve currency for other countries, which could have protected its down side in case of depreciation, our prediction for USD to INR is 100+ by 2030.

For more updates on Forex and Bonds, Please find the link below :

More updates

Gold Rate today and Gold’s Price Prediction

Our last article on Gold rate today and Gold’s price prediction was in April’21 and since then, it has been a volatile ride for Gold and its investors.

Gold rate today and Gold’s price prediction for near future are:

DatePrice in INR (MCX)Price in USD
29 Sep’21461001754
DatePrice in INR ( MCX )Price in USD
By Dec’22650002650

Gold today is most undervalued amongst all the financial asset classes and it may go up to its lifetime high by end of 2022.

Gold rate today is undervalued compared to other asset classes.

Weakness in US dollar, no sign of increase in interest rates post-Jackson Hole symposium in Aug’21 and demand for physical gold due to fast approaching festival season in India are all positives for this precious metal.

 At the highly anticipated Jackson Hole symposium last month, Fed Chair has indicated that any withdrawal of stimulus will be gradual, which is bullish for gold. Though its price movement is not expected to be linear amid the risk-on sentiment in stock markets, we advocate accumulating it at current and lower levels.

The central banks like Russia, China, and other banks are also adding gold to their reserves, which will keep its demand high. ETF buyers are also adding to their gold holdings as an inflation hedge. Global equity markets too are at very high levels and any correction in them will create more demand for this safe-haven asset.

Please find few other key reasons for our above Gold’s price prediction:

  1. Higher Government Debt across the world – Please find debt of few major countries in the world,
CountryDebt (in trillions, US$)% to GDP
US28107%
Japan9177%
France3.2110%
Spain1.6107%
UK398%

 As the size of Fed balance sheet keeps increasing because of debt monetization, it leads to an extended time and era of negative real interest rates which is very bullish for gold prices.

2. Higher Stimulus by central banks since March’20 – It dilutes the value of money and hence positive for asset prices like Gold.

3. Negative Real Yields – Real yields with high inflation and lower interest rates are here to stay and this will drive Gold to new highs. We expect this to continue and have a long term price target of gold closer to INR 250000(Per 10 gram) and $12500 (Per ounce) by 2030. Also US fed chairman, Jeremy Powell has finally admitted on 29 Sep’21 that inflation is not transitory and is expected to stay at elevated levels.

4. Geo Political Risk – This century from 2000 started with dot com bubble burst, 9/11 attacks, Global financial crisis, Covid 19 pandemic, etc. All these scenarios lead to investors and liquidity rush to Gold. The recent incidents of Taliban taking over Afghanistan and AUKUS alliance in between US, UK and Australia will only increase the tension in between world super powers.

Gold'd price predictions are very bullish and are on higher side.

Hence, we can conclude that this a good time to be accumulating gold. It has consolidated well enough after a stupendous rise in 2019 and 2020 and is posed to make money again for its investors.

Please click here to read more about our reviews on Gold :

NIFTY 50 Market Cap at Record High

Nifty 50 market cap has hit a record high of 137,865,624 million INR on Friday, 3 Sep’21 with Nifty 50 closing at an all-time high of 17323.

Please find Nifty 50 constituents  and their current market cap:

As on Sep 3, 2021
COMPANY NAMEMARKET PRICEMARKET CAP ( IN INR, MILLION)
Adani Ports754.91,533,769
Asian Paints3,338.803,202,570
Axis Bank7982,443,049
Bajaj Auto3,757.501,087,297
Bajaj Finance7,523.404,533,506
Bajaj Finserv16,734.402,663,062
Bharti Airtel658.53,592,212
BPCL491.31,065,754
Britannia4,124.20993,389
Cipla941.1758,955
Coal India146.4901,915
Divis Lab5,208.301,382,640
Dr Reddy’s4,898.60814,620
Eicher Motor2,802.60765,830
Grasim1,510.50993,802
Hcl Tech1,174.803,187,878
HDFC2,758.604,966,020
HDFC Bank1,576.108,680,343
HDFC Life Insurance734.41,483,823
Hero Motor2,799.50559,239
Hindalco461.31,036,349
HUL2,766.706,500,517
ICICI Bank724.35,000,345
Indusind Bank1,003.80759,944
Infosys1,700.707,244,068
IOC113.11,064,741
ITC210.62,591,457
JSW Steel690.91,670,058
Kotak Bank1,791.903,548,721
L&T1,691.502,375,300
M&M749.9932,270
Maruti6,863.102,073,206
Nestle20,266.701,954,024
NTPC1171,134,510
ONGC123.11,548,632
Power Grid175.6918,406
RIL2,388.5016,151,198
SBI431.43,850,077
SBI Life Insurance1,244.201,244,200
Shree Cement30,440.801,098,327
Sun Pharma789.41,894,035
Tata Consumer869.9801,612
Tata Motors295.6912,946
Tata Steel1,443.701,738,338
TCS3,842.1014,416,850
Tech Mahindra1,442.001,394,976
Titan2,019.301,792,707
Ultratech Cement7,929.902,288,847
UPL752.8575,173
Wipro655.13,744,118
TOTAL137,865,624 

The current level of Nifty 50 is:

This is testimony to our last post on 23’rd Aug’21, wherein we gave the target of 17100-17300 for Nifty 50.

This rally was supported and backed by better than expected Indian economic numbers that came this week :

  1. April-June quarter GDP expands 20.1% YoY
  2. Nominal GDP growth at 31.7%
  3. GVA expands 18.8% YoY
  4. Construction sector growth at 68.3%
  5. Manufacturing sector growth at 49.6%
  6. Mining sector growth at 18.6%
  7. April-July fiscal deficit nears Rs 3.21 trillion
Nifty 50 market cap and rising Indian economy.

India’s Gross Domestic Product (GDP) for the April-June quarter (Q1) of the ongoing financial year 2021-22 expanded 20.1% YoY, as per data released on 31 Aug’21. The sharp rise in Q1 GDP data can be attributed to a low base last year. In the April-June quarter of 2020, the economy contracted 24.4% due to the Covid-19 lockdowns. The economy grew by 1.6% for Q4 of FY21.

The reflection of above was clearly visible on nifty 50 move.

The final push on Friday was given by Reliance as its closer to its all time  high of 2400 with green energy speech and plans by Mr. Mukesh Ambani.

While India has picked up after covid 2’nd wave, there are still following challenges in rest of the world:

  1. Crackdown on tech and private sector in China by authorities
  2. Delta  and new variants of Covid posing a challenge in developed countries like US, Euro Zone, etc.
  3. Global supply chain staying disrupted because of covid 19 bottlenecks.
  4. Growth numbers receding in US. On Friday , 3 sep’21, non farm payroll data came in at 235k, much lower than the forecast of 750k. Non-farm Payrolls measures the change in the number of people employed during the prior month, excluding workers in the farming industry. Given that full employment is one of the Federal Reserves mandates, a weaker than forecast reading is generally negative (bearish) for the USD and signals that Fed support is going to continue without taper.
Nifty 50 market cap is rising amidst global economic problems.

With above background, India has outperformed other benchmark indices across the world and we expect it to continue for remainder of this year.

In short term, Nifty has achieved its target of 17300 and can follow a consolidation.

Now, some pullback and correction can follow which can be in the range of 5-20%.

Our stance in short term is cautious with profit booking and a micro based approach through individual stocks rather than on Index.

Please find our short term calls:

  1. Nifty 50- 16600-17600 range.
  2. Bullish on RIL, Tech and FMCG.
  3. Bullish on Banks and Insurance.
  4. Bearish on Auto’s because of less than expected demand and semi-conductor issue.

For more equity updates, please find our link:

Equity Updates